
The short answer
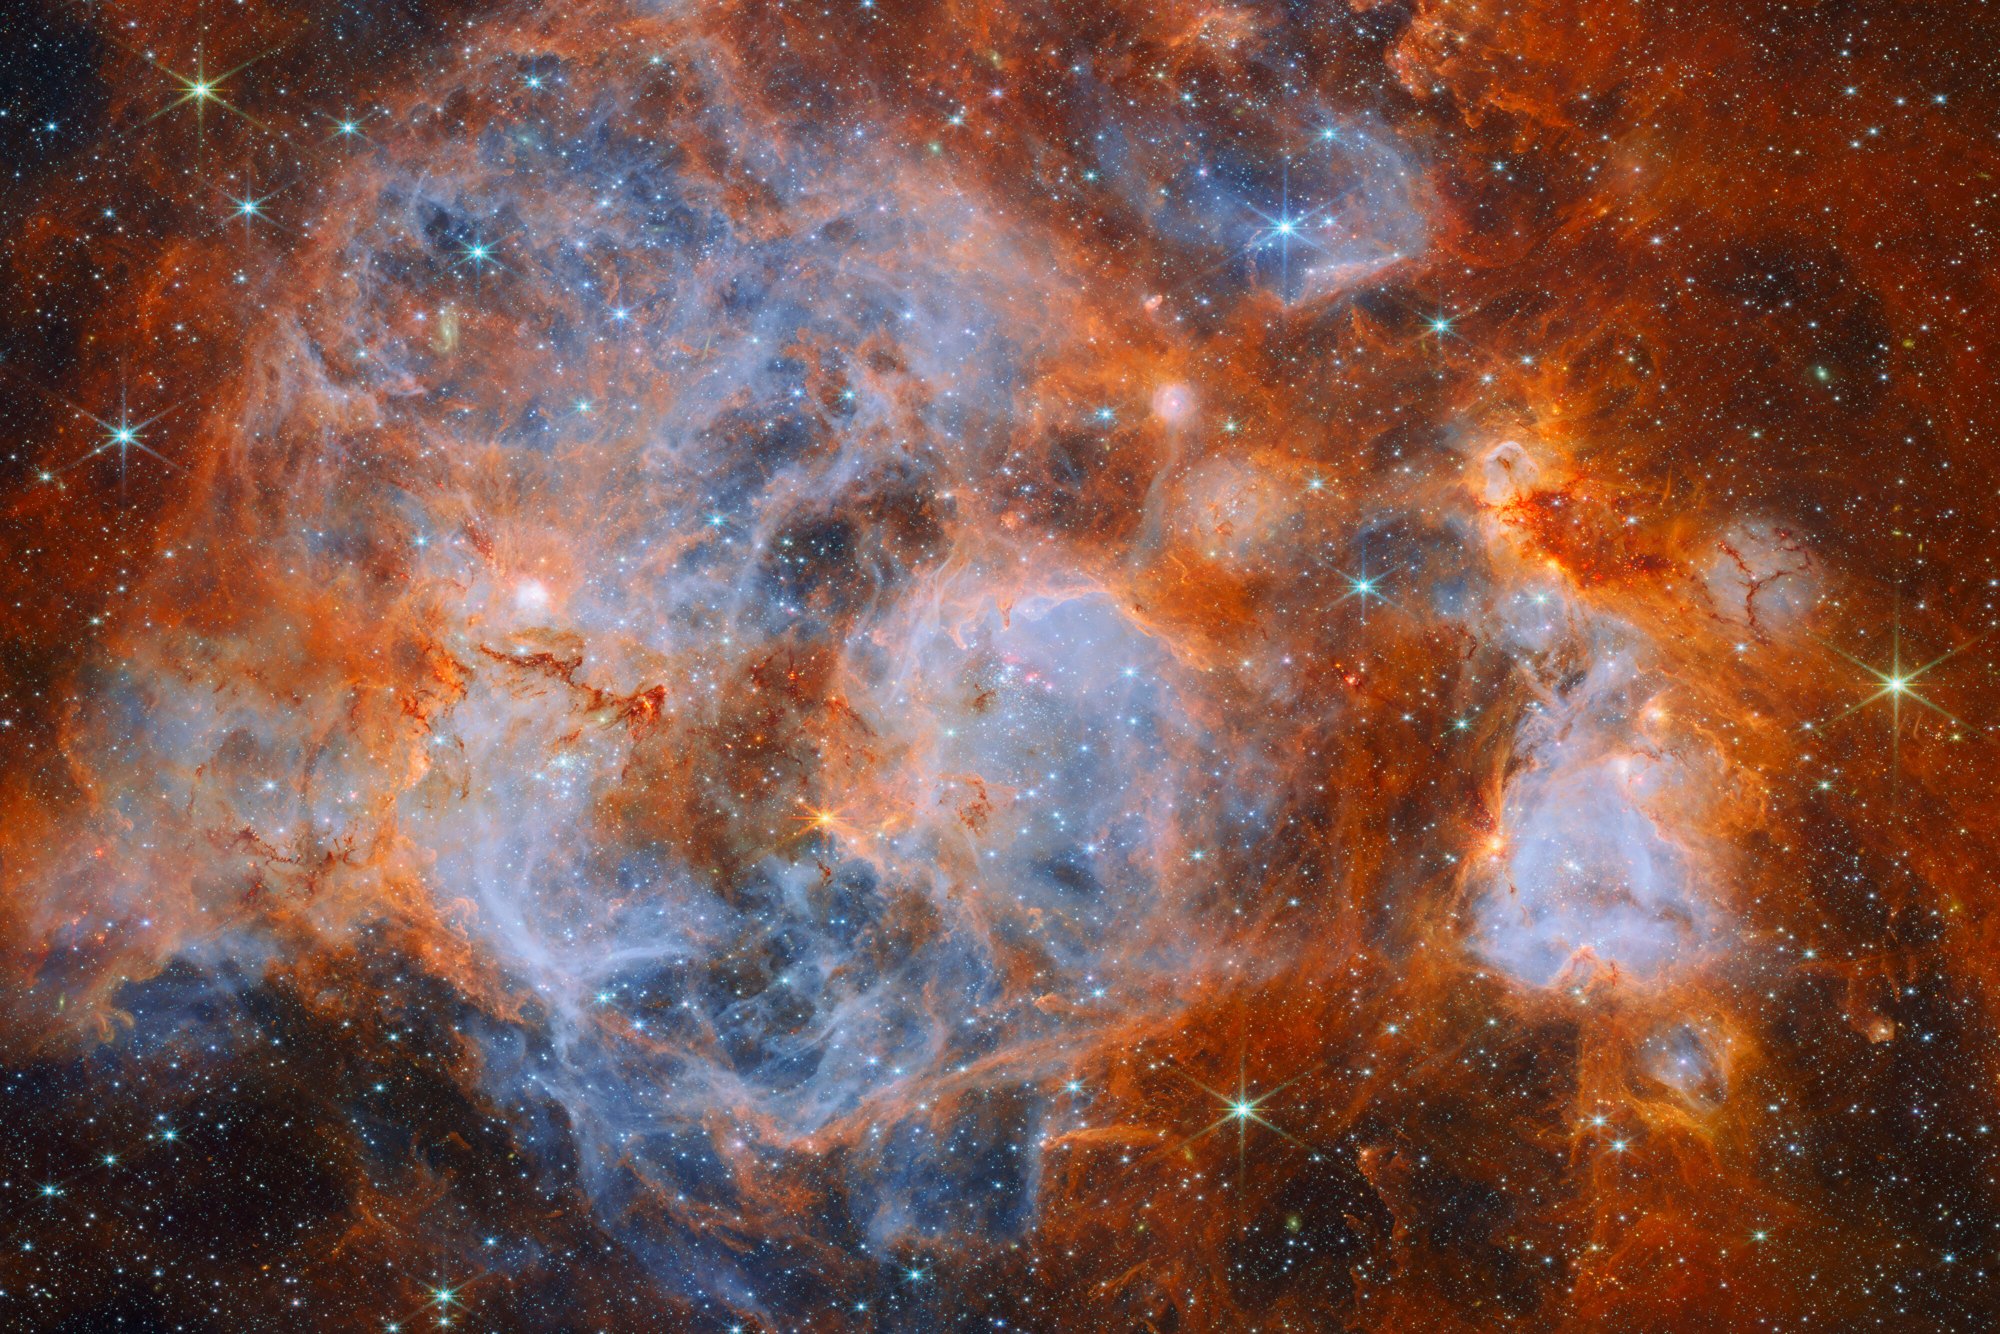
In October 2026, ESA released a new picture from the James Webb Space Telescope’s near-infrared camera. It shows N159, a region where new stars are forming in a neighbouring galaxy, the Large Magellanic Cloud. The file is about 62.7 megapixels, and its colours are assigned to light the human eye cannot see.
The image in numbers
161,000light-years from Earth
~230light-years across the frame
9694 × 6463pixels, about 62.7 megapixels
< 3 millionyears old, a very young region
A camera that sees infrared
Webb’s Near-Infrared Camera (NIRCam) took this image. Like any camera it records light, but infrared light has longer wavelengths than anything our eyes respond to. Dust clouds that block visible light let more infrared through, which is why Webb can show stars that are still forming inside their birth clouds.
Because we can’t see infrared, the colours in the final picture are chosen to represent it. Webb images typically map shorter infrared wavelengths to bluer tones and longer ones to redder tones. The colours are not invented at random. They are a way to show real differences in the light.
What the colours mean
Orange
Light from polycyclic aromatic hydrocarbons, carbon-based molecules mixed into the dust.
Pale blue
Clouds of ionised hydrogen gas, lit up by radiation from massive young stars.
Dark red filaments
Cool, dense hydrogen gas that shelters new stars from radiation and stellar winds.
On the left of the frame is the Papillon Nebula, a compact blob of ionised hydrogen that Hubble first resolved in 1999.
What photographers can learn from it
- Scale and depth. The frame spans about 230 light-years, yet it still holds foreground structure, background stars and layered clouds. Look at how the dark ridges and thin red filaments separate the brighter gas.
- Colour as information. The palette separates different materials. The same idea works in your own editing: use colour to guide the viewer to what matters, not just to look pretty.
- Huge range of brightness. Dense star clusters glow inside bubbles of gas, next to dim, wispy clouds. Images like this are assembled and processed from the telescope’s data, not captured as a single snapshot.
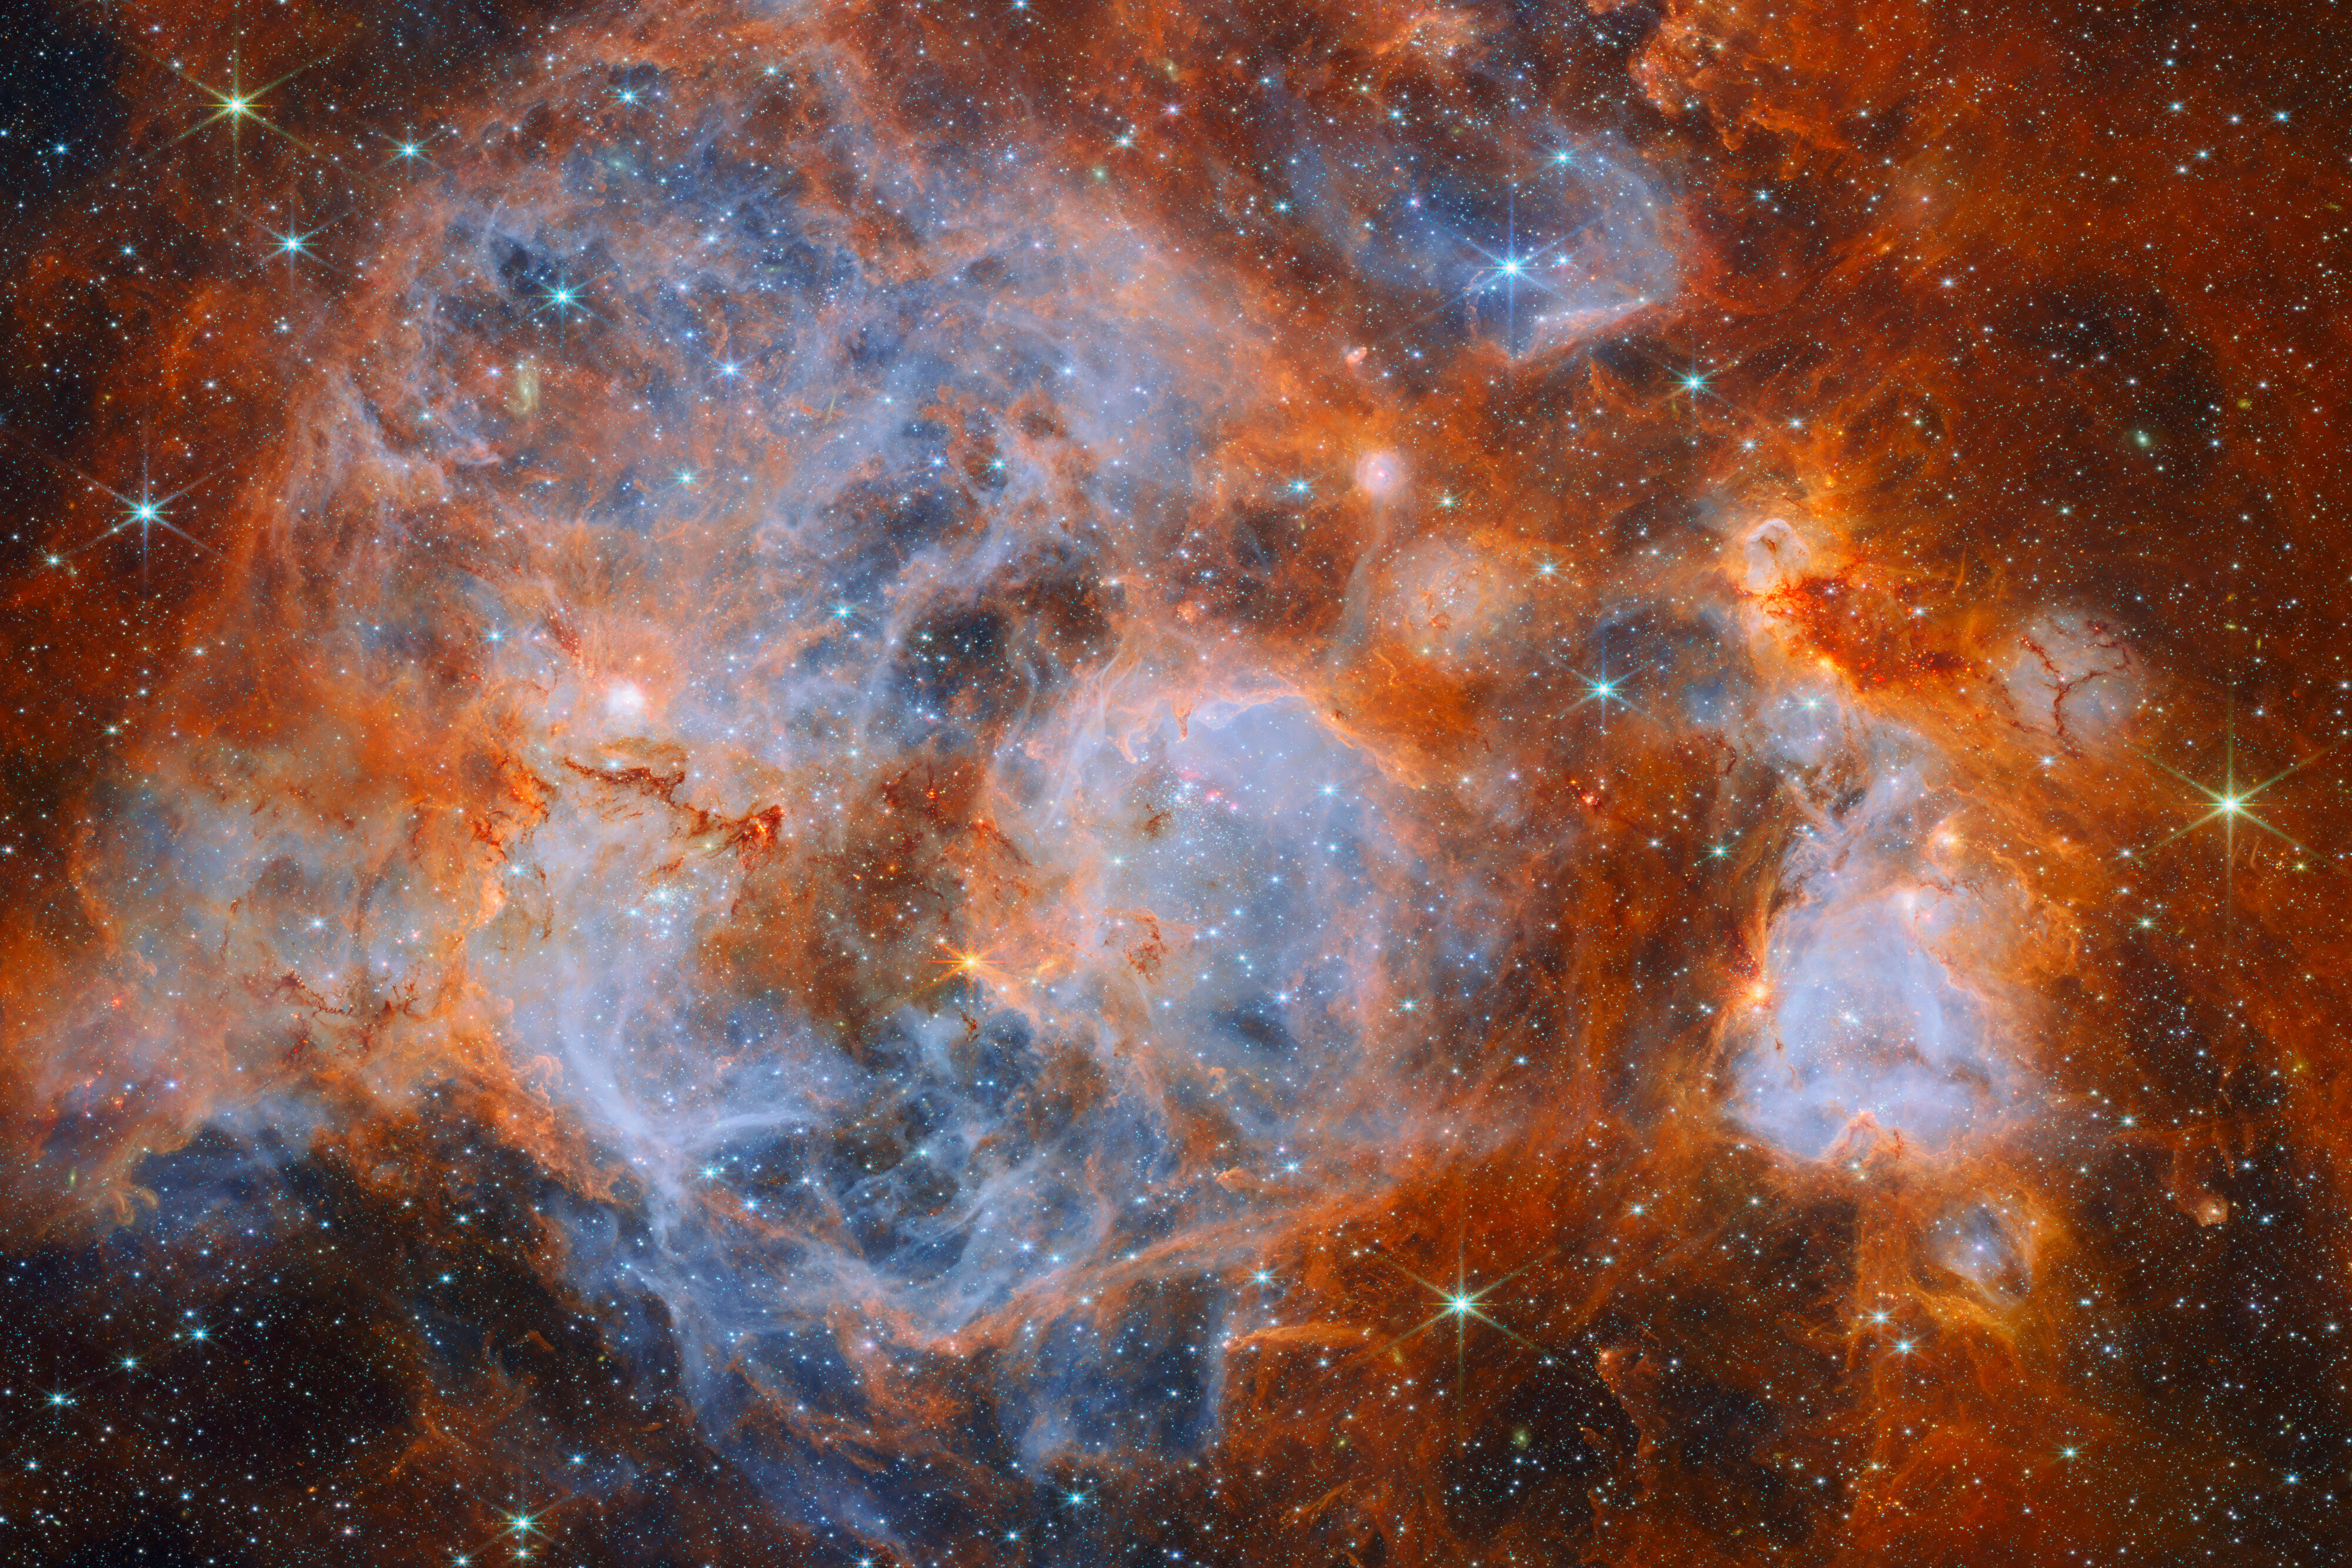
- Resolution gives you room. At 62.7 megapixels, the file rewards zooming in, which is why the original is so much larger than the web version.
Using the image on your own site
ESA/Webb releases its images under the Creative Commons Attribution 4.0 licence. You can use them without asking permission, including commercially, as long as you follow the credit rules:
- Show the credit line clearly and unaltered next to the image. For this picture it is: ESA/Webb, NASA & CSA, E. Sabbi, M. Zamani (ESA/Webb). Acknowledgement: M. H. Özsaraç.
- Link the credit online.
- If you change the image beyond resizing or cropping, add a note about the changes after the credit.
- Don’t imply that ESA/Webb endorses a product or service. Its logos aren’t covered by the licence.
The bottom line
This image shows what a very large infrared camera can do with a dusty star-forming region 161,000 light-years away. Beyond the astronomy, it’s a good lesson in how colour, resolution and processing turn data into a picture.
Sources
-
ESA/Webb: Stars brewing in a nebulous cauldron (image page)
https://esawebb.org/images/potm2610a/ -
ESA: Stars brewing in a nebulous cauldron
https://www.esa.int/ESA_Multimedia/Images/2026/10/Stars_brewing_in_a_nebulous_cauldron -
Phys.org: Webb image reveals young stars brewing in a nebulous cauldron (release text, republished)
https://phys.org/news/2026-10-webb-image-reveals-young-stars.html -
ESA/Webb: usage of images, videos and texts
https://esawebb.org/copyright/
Information is accurate to the sources above as of 25 October 2026. The instrument (NIRCam) comes from the republished release text, so check it against the original ESA/Webb release if you need to cite it. The colour-mapping point is a general description of how Webb images are usually made, not a detail from this release.